
XAUUSD: Wave-4 Triangle Nears Completion, Wave 5 Down Toward 3,920
Key facts
Gold is finishing a contracting triangle in wave 4. An ending diagonal capped wave E near 4,198 and its lower line has broken on M5. We sell a retest of 4,172–4,185 for a triangle thrust toward 4,075 and 3,920.
- Bias: bearish (sell).
- Entry zone 4,172.00–4,185.00, stop loss 4,206.00, targets 4,075.00 then 3,920.00, invalidation 4,218.00.
- Primary scenario 65%, alternate 35% (switches if: An H1 close above 4,218, which is above the C high of the triangle).
- Status: waiting for the trigger. Published 2026-10-19 12:53 UTC; levels locked at publishing.
The big picture
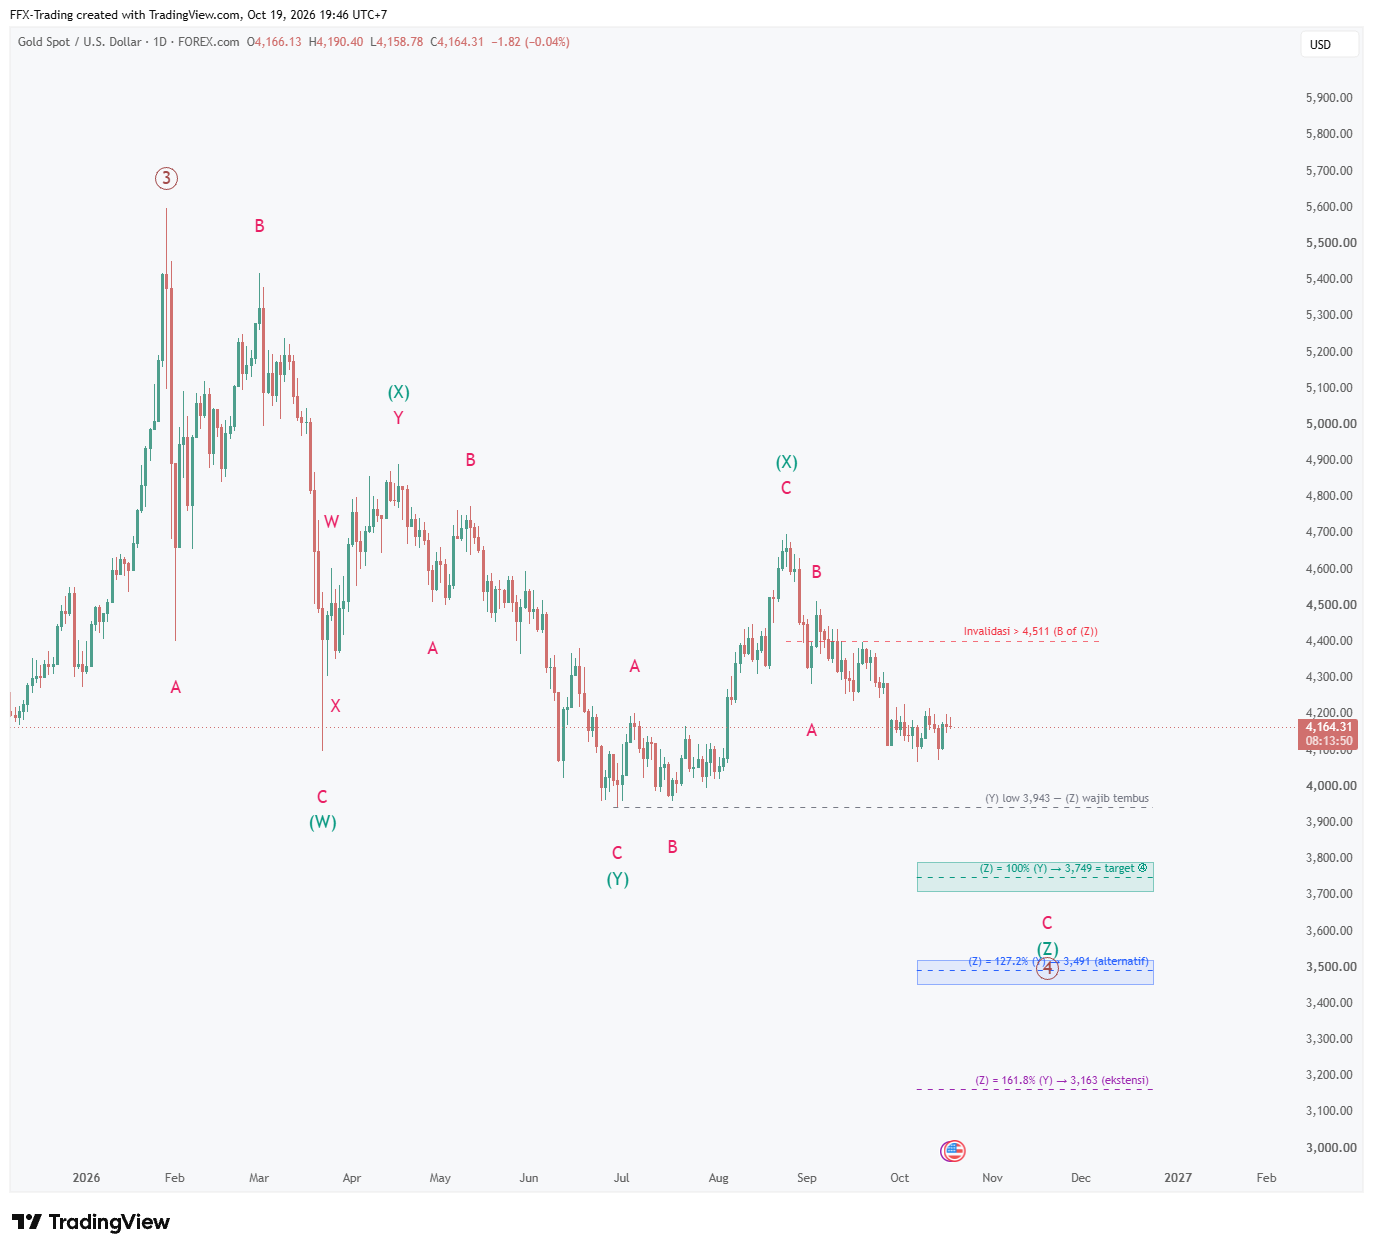
On the daily chart gold is tracing a W-X-Y-X-Z combination down from the January peak, which we count as wave (3). Wave (Y) bottomed at 3,943. Wave (X) topped near 4,700 in late August, and wave (Z) is now unfolding lower. Inside (Z), wave A is complete and wave B peaked at 4,511. Wave C is in progress. On H4, wave C subdivides into five waves. Wave 2 capped at 4,400 and wave 3 reached about 4,110. Wave 4 has been a sideways contracting triangle since early October. For (Z) to be valid it must take out the (Y) low at 3,943. Our main (Z) target is 3,749, where (Z) equals (Y), with 3,491 as the 127.2% alternative. Above 4,511 the bearish count on the higher timeframes is invalid.
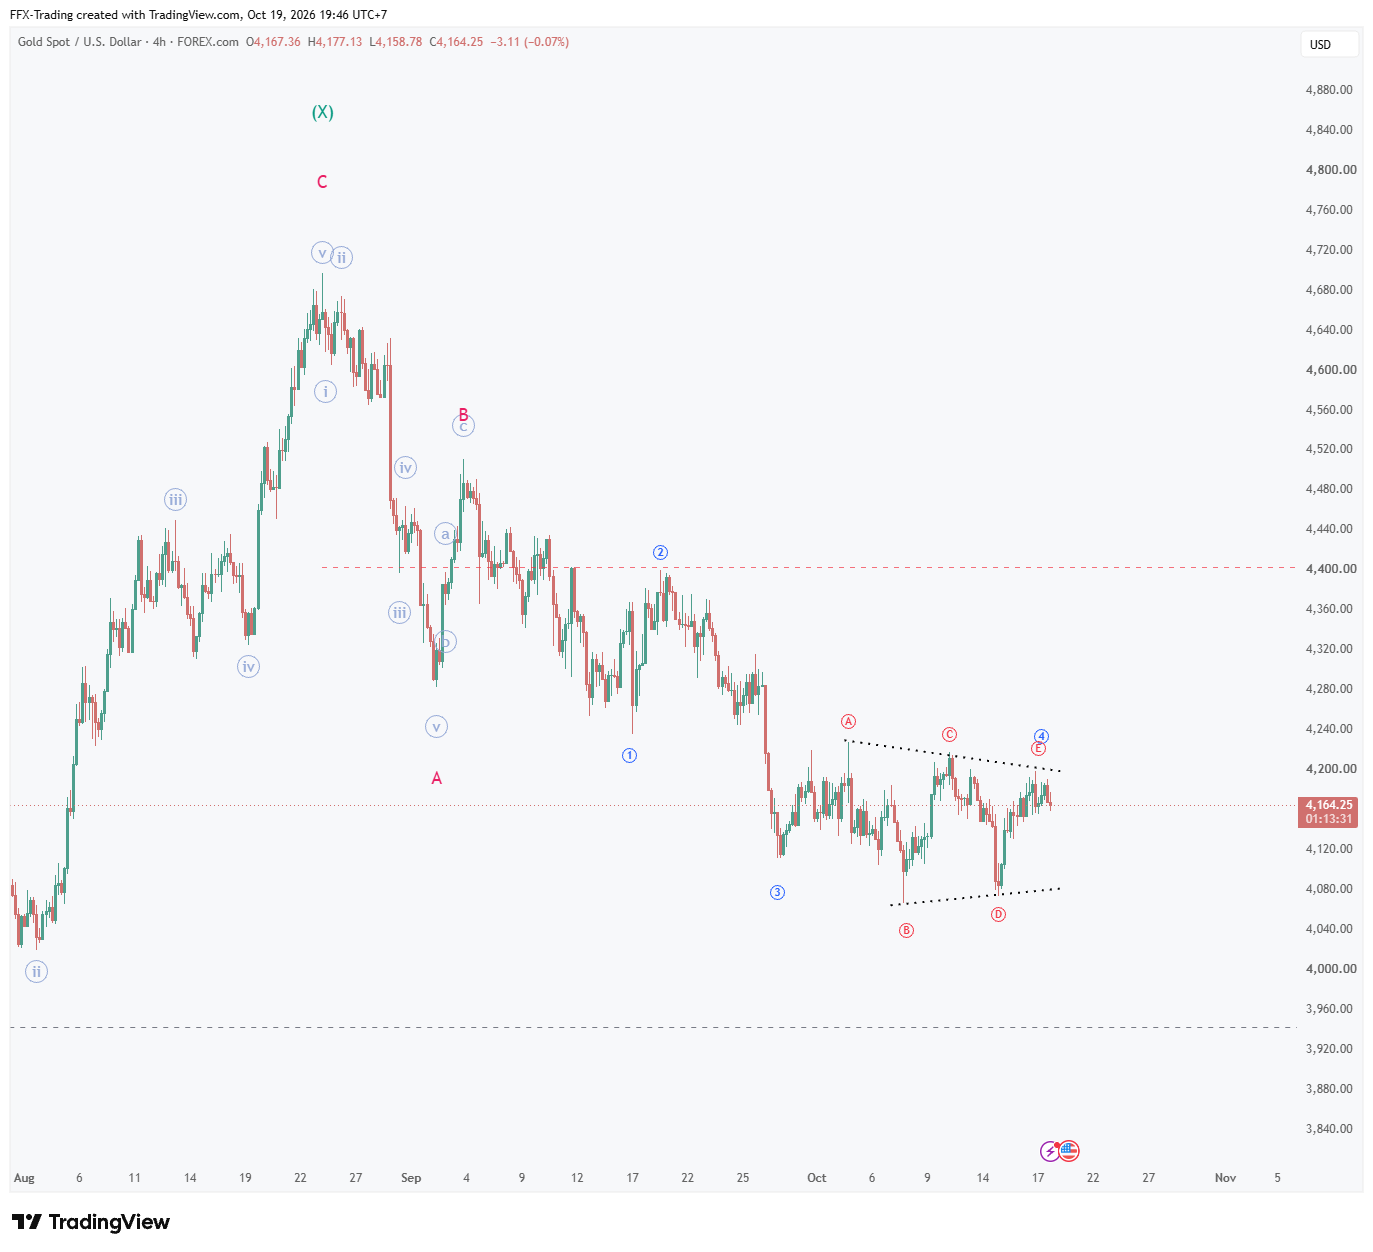
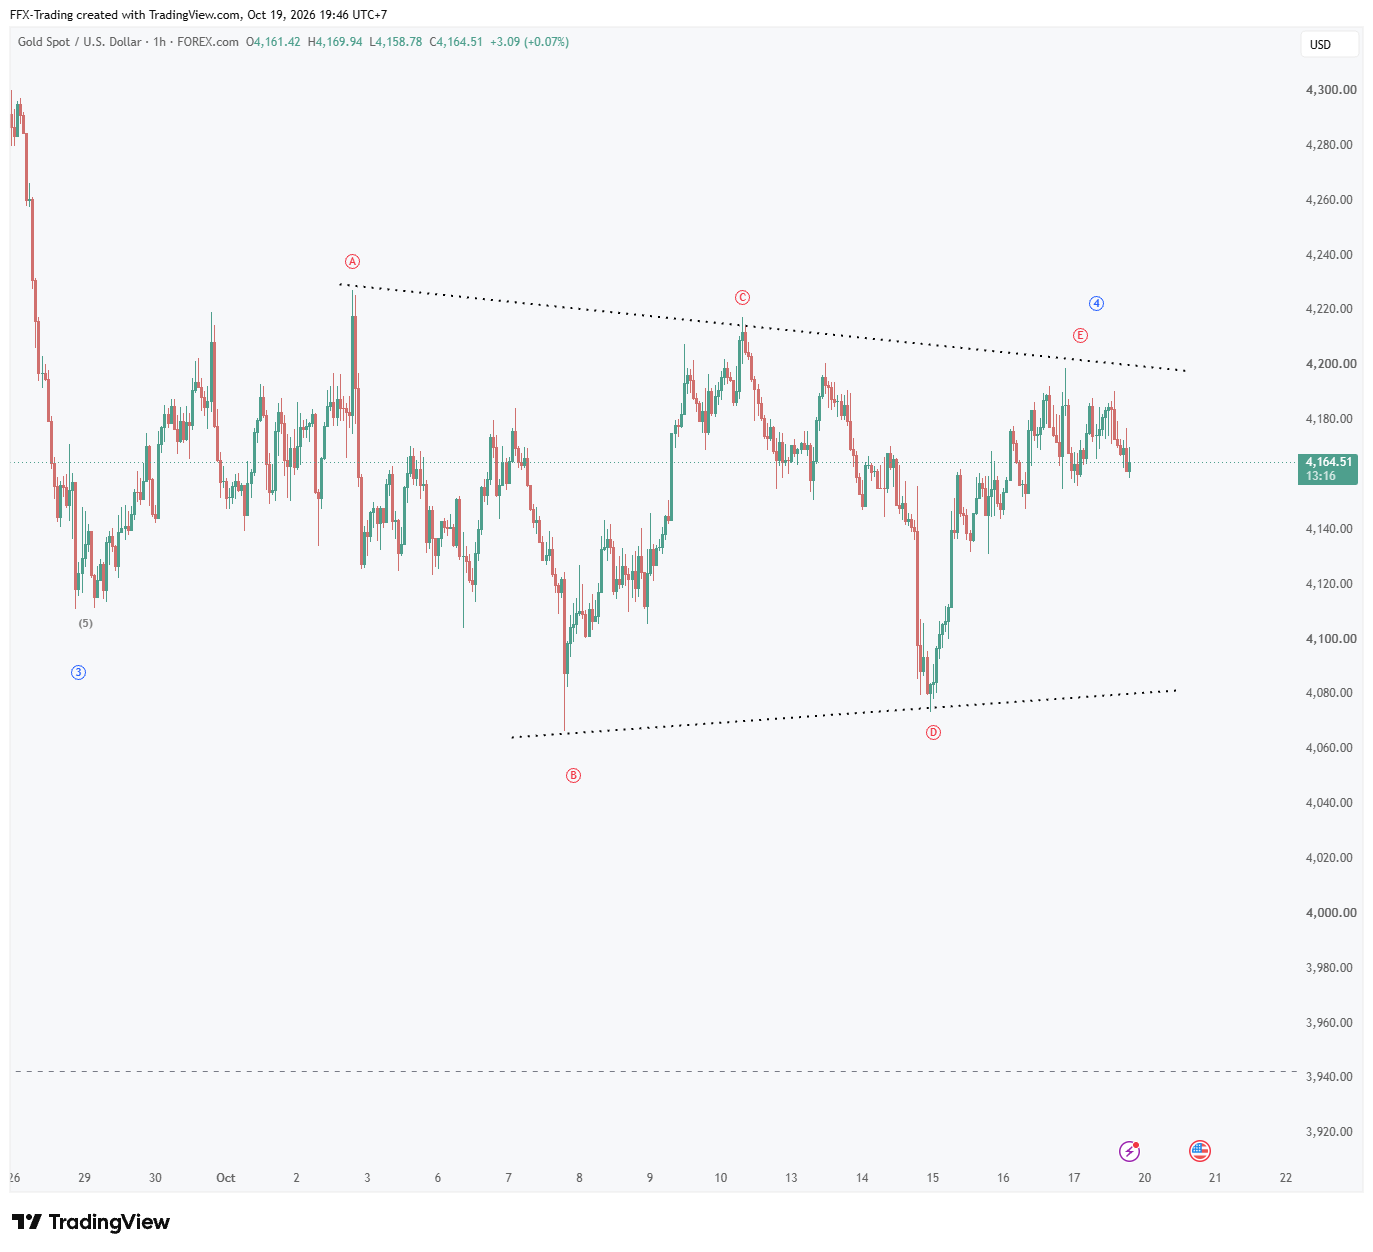
On H1, wave 4 is a contracting A-B-C-D-E triangle. The points are A at 4,228, B at 4,066, C at 4,217, D at 4,074 and E near 4,198. The upper trendline runs through A and C and now sits near 4,200. The lower trendline runs through B and D and sits near 4,080. Wave E stopped just under the upper line, which is the textbook place for a triangle to finish. Breaking below the B-D line confirms wave 4 is done and points to the post-triangle thrust of wave 5. The widest part of the triangle (A to B) is about 160 points. Measured from a break near 4,080, that gives a thrust objective around 3,920, just below the 3,943 (Y) low.
Scenario
Primary scenario
65%Wave E and the triangle are complete at about 4,198. Gold breaks below the B-D line near 4,080 and starts the wave-5 thrust of C of (Z). The first target is 4,075. If price closes on H4 below 4,066 (the B low), that confirms the move toward 3,920–3,943, the area where (Y) gets taken out. After that, the larger (Z) path opens toward 3,749.
Alternate scenario
35%The triangle count is invalid, and wave 4 is still developing as a flat or a more complex correction. Price can then squeeze toward 4,260–4,300 and test the wave-2 area below 4,400. The bearish wave-5 view only resumes after a new topping structure forms. Above 4,511, the whole (Z) count is invalid.
See the M15 & M5 entry
Entry zone, stop and targets broken down on the lower timeframes.
Status log
Revision log
No revisions. Levels are unchanged since publish.
Found this useful?
Eightwaves is free. A coffee keeps the analysis coming.
Analysis and education only, not a recommendation to trade. Trading forex, commodities and crypto carries a high risk of loss.