
Entry breakdown
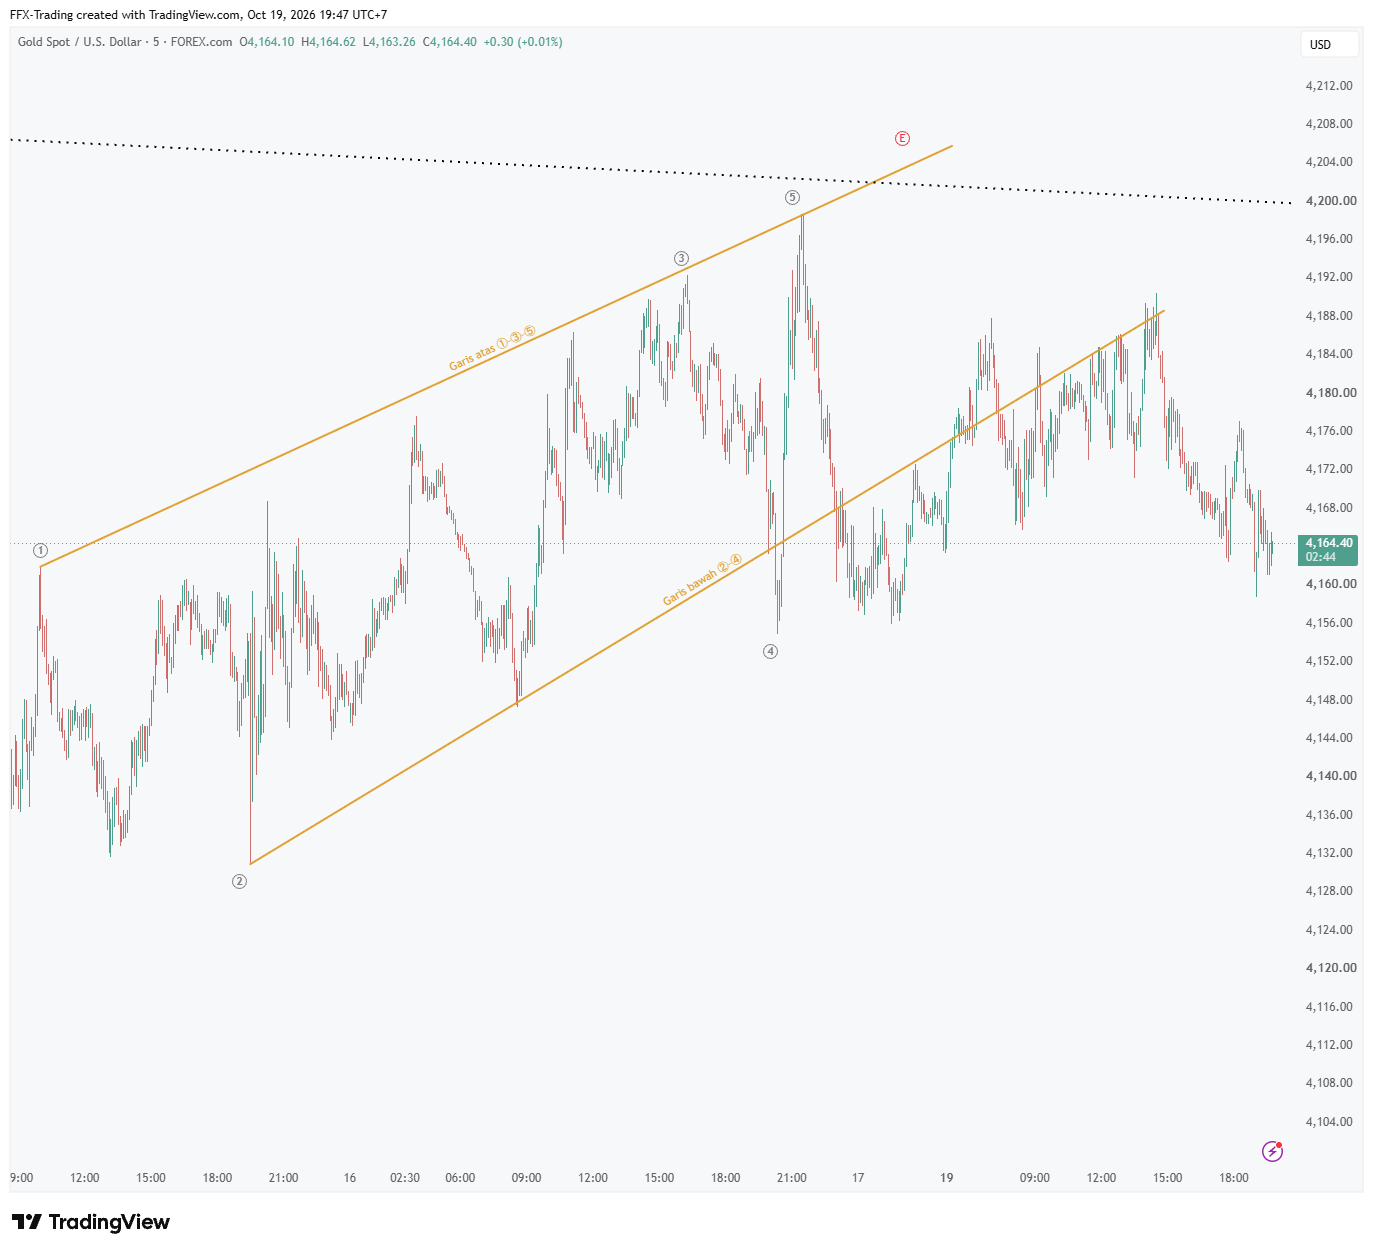
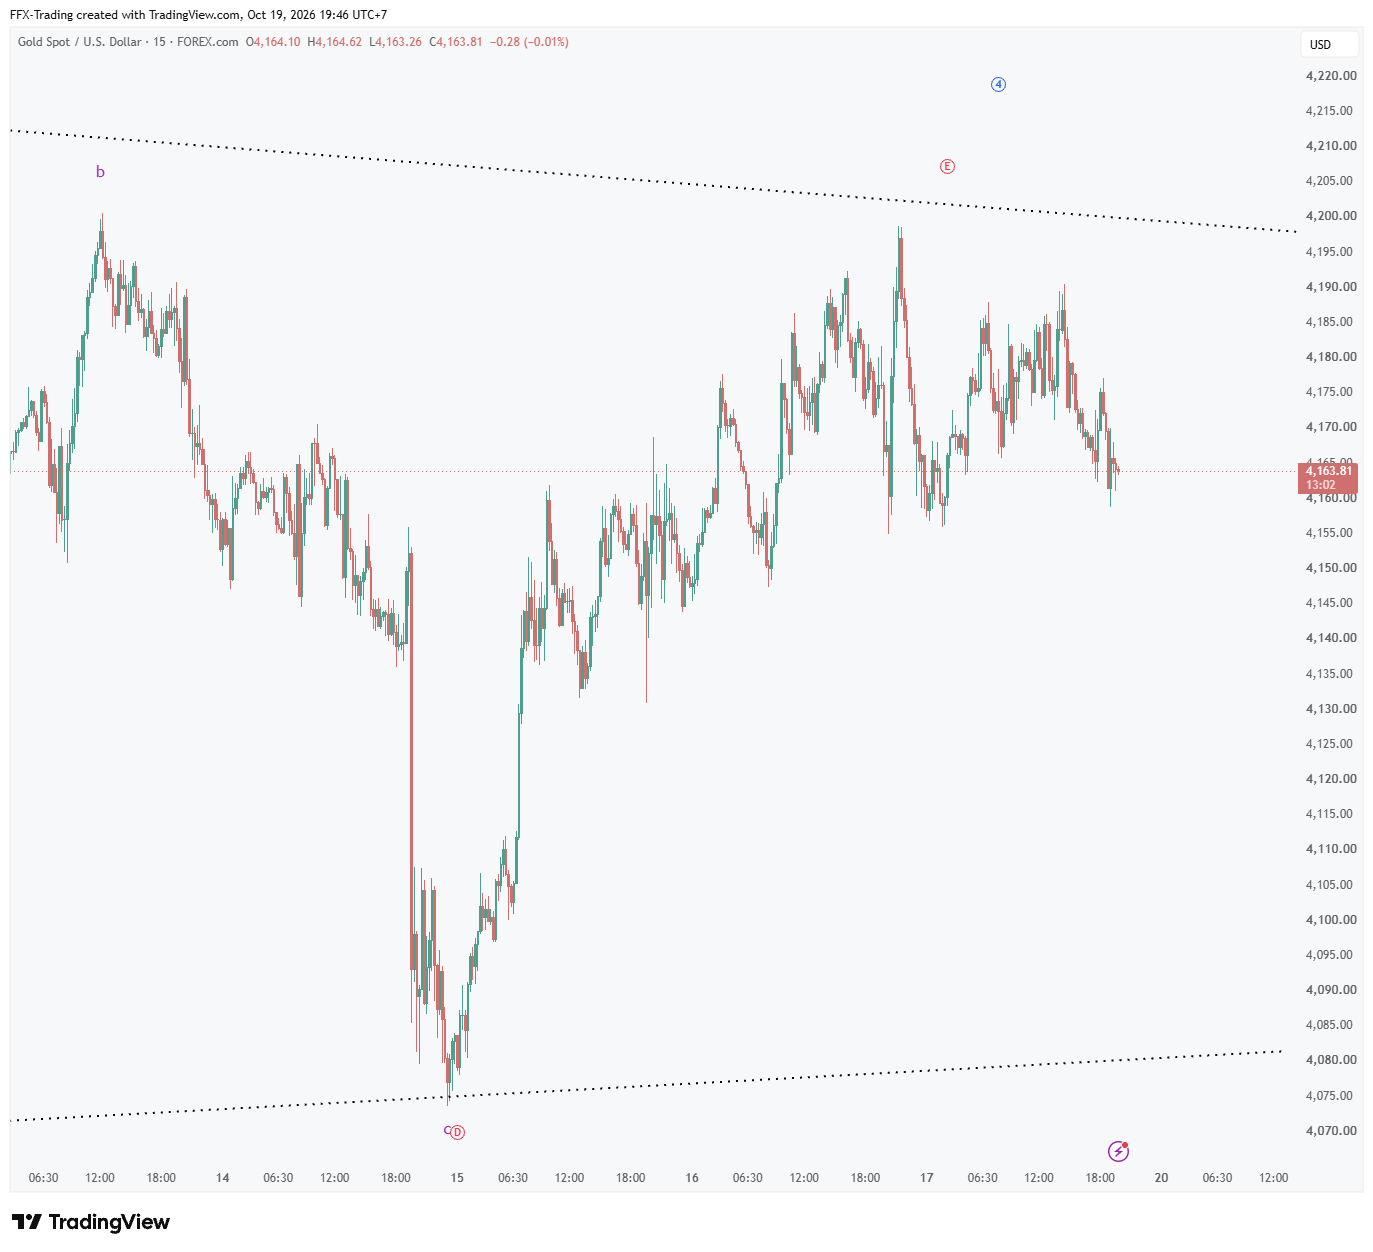
Lower-timeframe structure inside the entry zone. Levels match the summary card exactly.
On M15, the rally off the D low (4,074) is the E leg, and it has stalled under the triangle's upper line near 4,198. On M5, wave E finished as an ending diagonal. Its upper line runs through points 1, 3 and 5, and the 5th wave peaked near 4,198. The lower line runs through points 2 and 4, and price has now broken below it. We sell a pullback into 4,172–4,185, which is where the broken diagonal line is being retested. Stop loss goes at 4,206, above the E high and the triangle line. TP1 is 4,075, the B-D line and D low; take partial profit there and move the stop to break-even. TP2 is 3,920, the measured triangle thrust. If price drops through 4,155 without a pullback, we don't chase it. Wait for a retest of 4,160–4,165 or skip the trade.
Analysis and education only, not a recommendation to trade. Trading forex, commodities and crypto carries a high risk of loss.